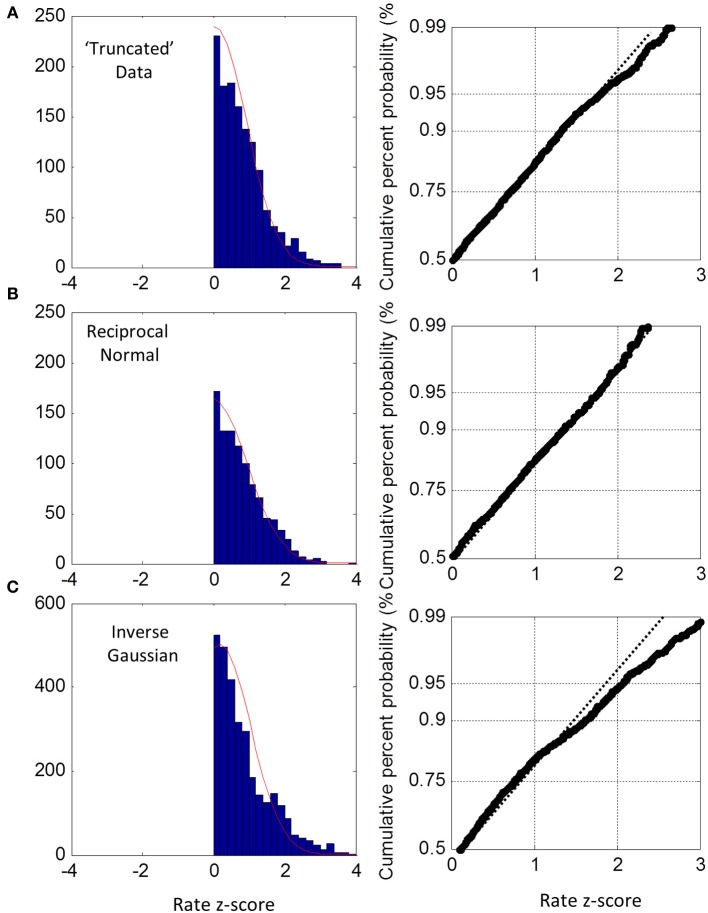
Figure 6.
Truncated group rate histograms (left column) and rate probit plots (right column), shown only for positive z-scores (see text). (A) Empirical rate from “truncated” blocks (c.v. > 0.4) showing near Normal distribution over 50–95% percentiles; (B) simulated data using reciprocal Normal RTs showing near perfect Normal distributions (as expected). (C) Simulated data using inverse Gaussian RTs showing obvious deviations from Normal rate.

