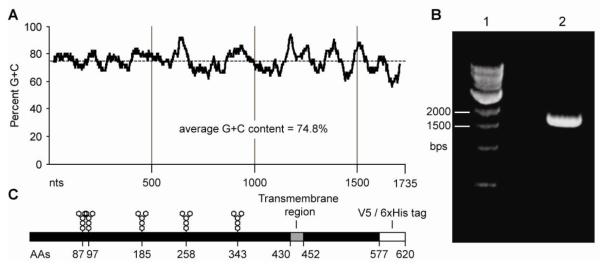
Figure 1.

gE structural features and PCR amplification (A) GC content of the gE gene. 50 bp sliding window scan of the gE gene open reading frame. The overall GC content is 75%, ranging from 56% to a high of 94% (B) PCR amplification of the gE gene using betaine as a PCR enhancer. Lane 1: 1000 bp marker (NEB), Lane 2: PCR reaction. (C) Diagram of the recombinant gE gene product. N-linked glycosylation sites, the predicted transmembrane domain, as well as the position of tags picked up from the baculoviral vector are indicated.
