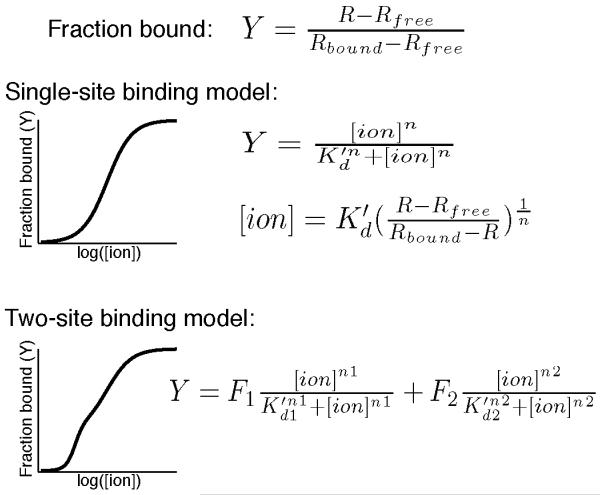
Fig. 3.
A sensor’s Kd’ is calculated by fitting experimental data to a single-site or two-site binding model. An example of each binding curve is shown next to the equation relating the [ion] to the fraction bound (Y), which is calculated from the FRET ratio (R), Rfree, and Rbound. When the single-site binding model is used, the [ion] is readily calculated using the displayed equation.

