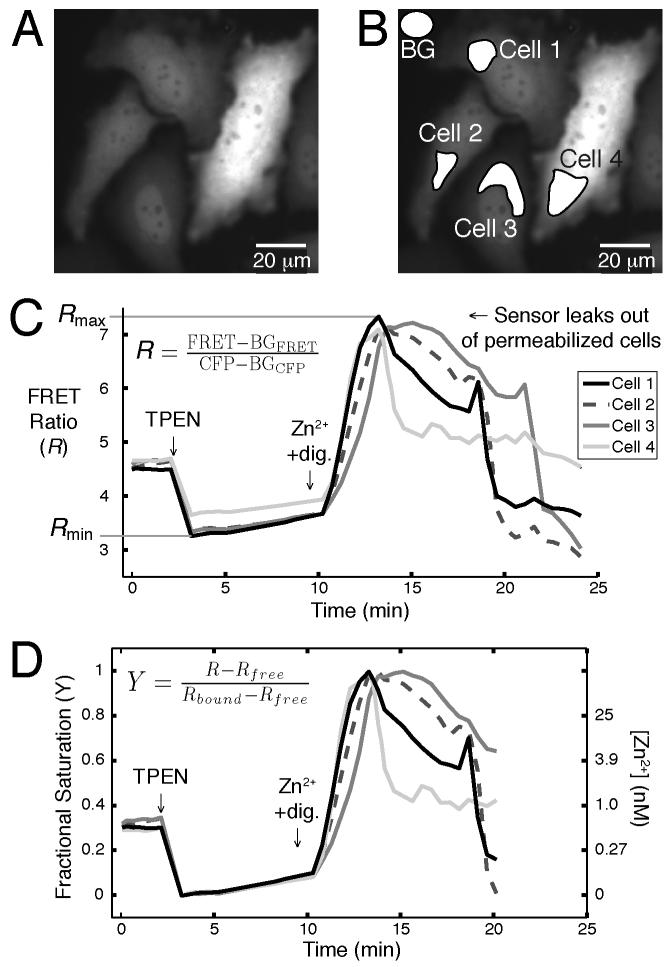
Fig. 5.
A typical analysis of a Zn2+ sensor calibration is shown. Regions of interest (ROIs), including a background (BG) region, are selected in the acquired FRET and CFP images in (A) and (B). The mean intensity of each region is exported into a spreadsheet (or equivalent). The mean intensity of the BG region (BGFRET or BGCFP) is subtracted from the mean intensity of each cell’s ROI (FRET or CFP), and the equation in (C) is used to calculate the FRET ratio (R). (D) shows a plot of the sensor’s fractional saturation (Y) over time and indicates the Zn2+ concentrations corresponding to Y.

