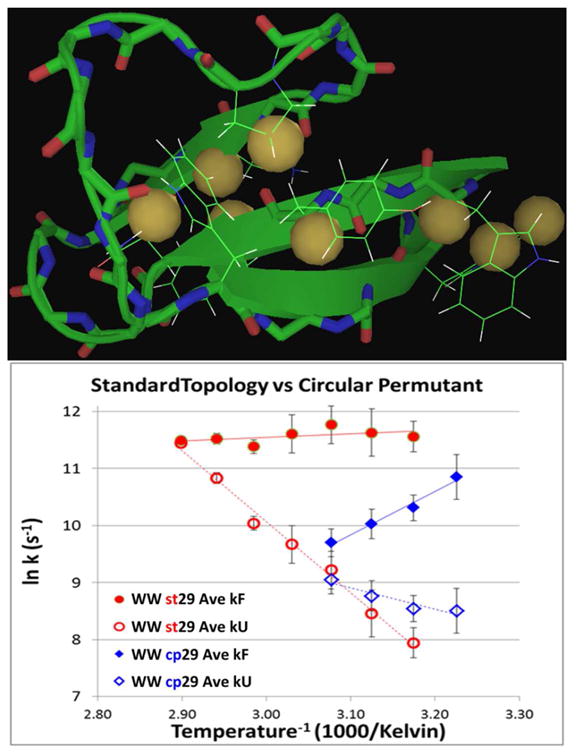
Figure 7.

Upper panel: locations of the probes in the WW domain fold (illustrated on the NMR structure of the circular permutant). Lower panel: Arrhenius plots for folding and unfolding rates of the standard- topology WW domain (st29) and its circular permutant (cp29). The points are data averaged over all available probes at each temperature. The probe identities and individual ln k values appear in the SI (Fig. S8).
