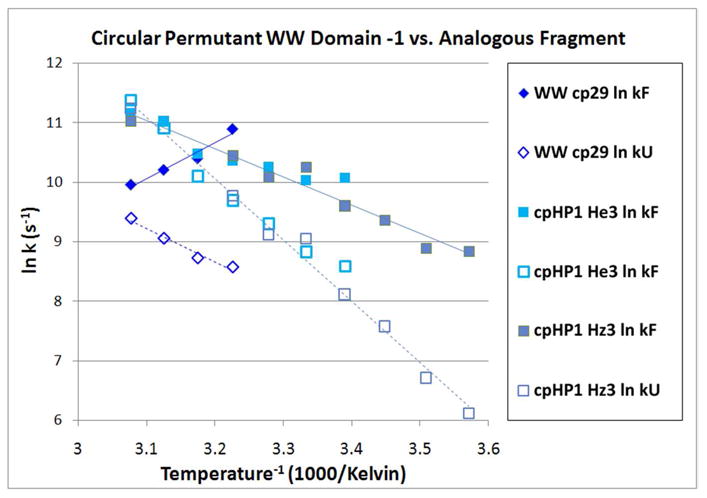
Figure 8.

Inverse log plot folding & unfolding rates plots for WW cp29 and hairpin fragment cpHP1. In the case of the hairpin, rate data from two ring-current shifted sites (W17 Hε3 and Hζ3) are shown: the lines represent a single linear fit to all of the data.
