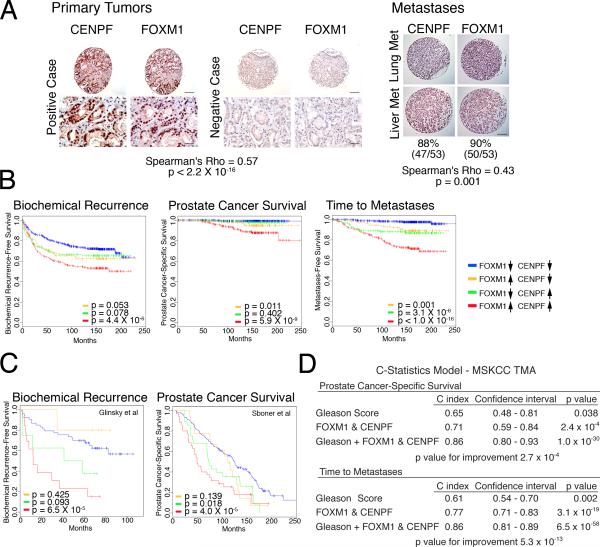
Figure 7. Clinical validation of FOXM1 and CENPF in human prostate cancer.
(A) Analysis of tissue microarrays (TMAs). Representative images from the MSKCC prostatectomy TMA and the Michigan metastasis TMA showing FOXM1 and CENPF protein expression; Spearman correlation of their co-expression with p value is shown. Scale bars represent 10 μm (lower Primary Tumor) or 100 μm (all others). (B) Kaplan-Meier survival analysis based on protein expression levels of FOXM1 and CENPF in MSKCC prostatectomy TMA with respect to time to biochemical recurrence, time to prostate cancer-specific death, or time to metastatic progression. (C) Kaplan-Meier survival analysis based on the ARACNe-inferred activity levels of FOXM1 and CENPF (Supplementary Experimental Procedures) in two independent human prostate cancer datasets using biochemical recurrence-free survival (Glinsky et al., 2004) or prostate cancer-specific survival (Sboner et al., 2010) as disease endpoints. In panels B and C, the p values correspond to a log-rank test and indicate the statistical significance of the association with outcome for each indicated branch compared to control (i.e., patients with low activity levels of both FOXM1 and CENPF, blue line curve). (D) C-statistics analysis, based on the protein levels of FOXM1 and CENPF from the MSKCC TMA, using death due to prostate cancer and time to metastasis as evaluation endpoints.
See also Figure S5

