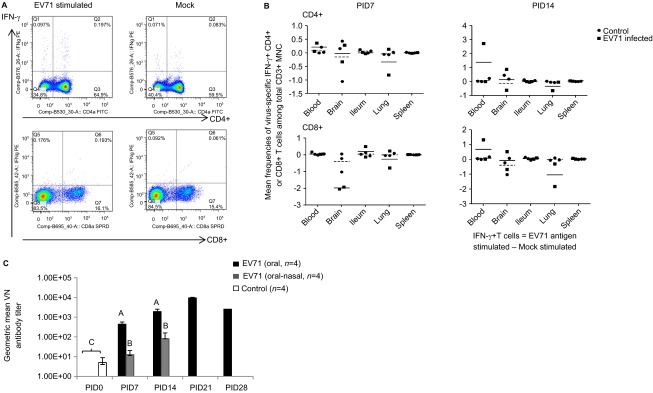
Figure 5.

Immune responses during EV71 infection in neonatal gnotobiotic pigs. (A) Representative dot plots showing the frequency of CD3+CD4+IFN-γ+ and CD3+CD8+IFN-γ+ T lymphocytes among the total CD3+ mononuclear cells in the blood. MNCs were stimulated with semi-purified whole EV71 antigen or control medium for 17 h prior to staining. (B) The frequency of IFN-γ-producing CD3+CD4+ and CD3+CD8+ T cells among the CD3+ mononuclear cells in the ileum, spleen, blood, brain and lung on PID 7 and PID 14 after EV71 BJ110 infection via the oral–nasal route in neonatal gnotobiotic pigs. The mean frequencies were calculated by subtracting the mean frequency value of medium/mock stimulated cells from the mean frequency value of virus-stimulated cells. A positive mean frequency value indicates that IFN-γ production was upregulated upon virus stimulation, whereas a negative mean frequency value indicates that IFN-γ production was downregulated upon virus stimulation. The mean value for the EV71-infected group is indicated by the solid line, and the mean value for the mock control group is indicated by the dashed line. (C) Serum neutralizing antibody response in EV71-infected neonatal gnotobiotic pigs. Different uppercase letters (i.e., A, B and C) indicate significant differences between different treatment groups and different time points within the same treatment group. Shared uppercase letters or no letters indicate that no significant differences were observed. (Kruskal–Wallis test, P<0.05; n=4). MNC, mononuclear cell.
