
Figure 2.
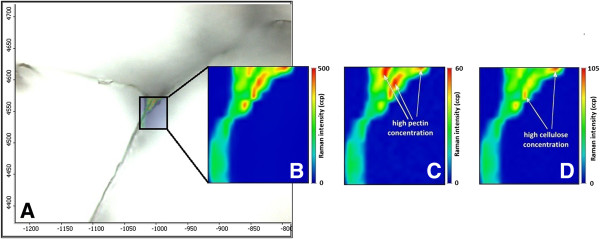
Images of the tomato cell wall. A) microscopic image (300 × 400 μm); B) Raman image of all primary cell wall polysaccharides at 2, 940 cm-1, γ(CH); C) Raman image of pectin at 854 cm-1, the (COC) skeletal mode of α-anomers; D) Raman image of cellulose at 1, 090 cm-1, γ(COC) glycosidic.