Figure 2.

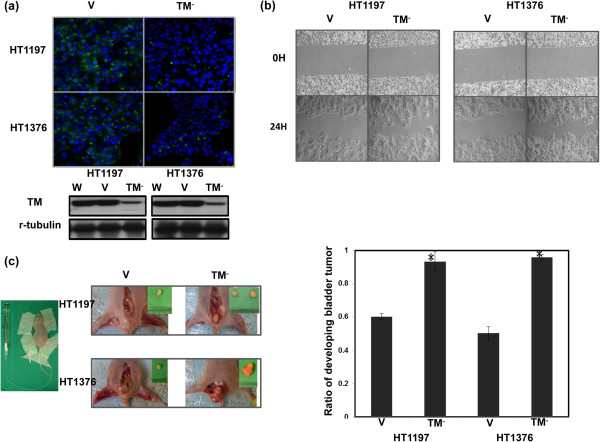
Role of TM in tumor invasiveness. (a) IF and Western blot analyses demonstrated the effects of the TM silencing vector on TM expression in HT1197 and HT1376 cells. Representative micrographs are shown (DAPI = blue; TM = green). TM levels were significantly decreased by the TM silencing vector compared with the control vector (CV). (b) The invasive capacity of bladder cancer cells expressing the TM silencing vector or CV was evaluated by migration scratch assays. The results from representative slides are shown. (c) The invasive capacity of bladder cancer cells was evaluated using murine orthotopic tumor implantation. The representative slides and quantitative data are shown. The y-axis represents the ratio of mice presenting intravesicular tumors normalized to that received orthotopic tumor implantation. The TM silencing vector increased the rate of tumor implantation in the bladder and was associated with larger tumor size. Data are expressed as the mean of three separate experiments ± SD; * P < 0.05.
