
Figure 1.
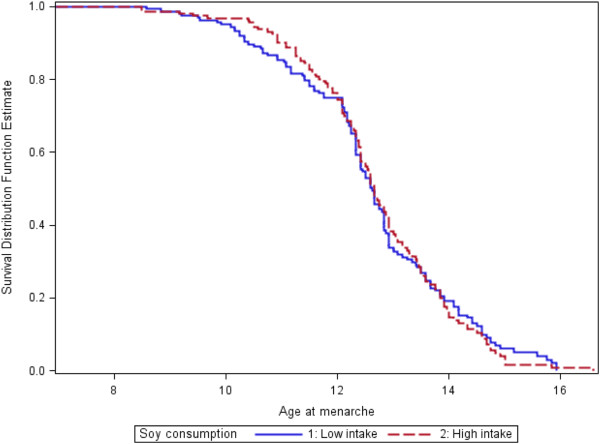
Age at menarche survival curves for low- and high-soy consumers. Legend: Kaplan-Meier survival curves are shown for both low and high consumers of soy. Median AOMs are 12.67 (low intake) vs. 12.58 (high intake) for B (plog rank test = 0.84). Values are energy-adjusted. Age at menarche is in years.