
Figure 2.
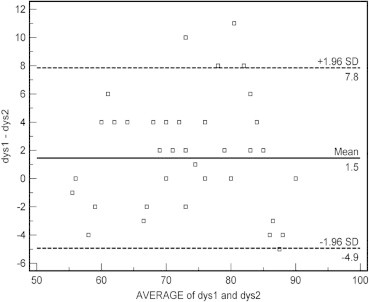
Bland–Altman scaterplot: Difference of diastolic blood pressure between Datascope Accutorr Plus™ (dys1) and mercury sphygmomanometer (dys2).
Official websites use .gov
A
.gov website belongs to an official
government organization in the United States.
Secure .gov websites use HTTPS
A lock (
) or https:// means you've safely
connected to the .gov website. Share sensitive
information only on official, secure websites.
Bland–Altman scaterplot: Difference of diastolic blood pressure between Datascope Accutorr Plus™ (dys1) and mercury sphygmomanometer (dys2).