
Figure 3.
Simulation results: (a) the gold standard, (b) CSI reconstruction from 16 × 16 spatial encodings, (c) EPSI reconstruction from 128 × 128 spatial encodings averaged twice, and (d) SPICE reconstruction from 8 × 8 CSI encodings in
 , 48 echo-shifts in
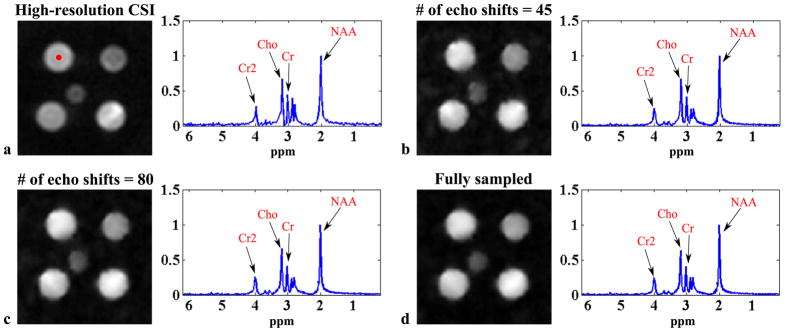
 averaged four times and L = 8. The left column shows the spatial distributions of a frequency component at 345 Hz and the right column shows the spectra corresponding to the voxel identified by the red dot for each case.