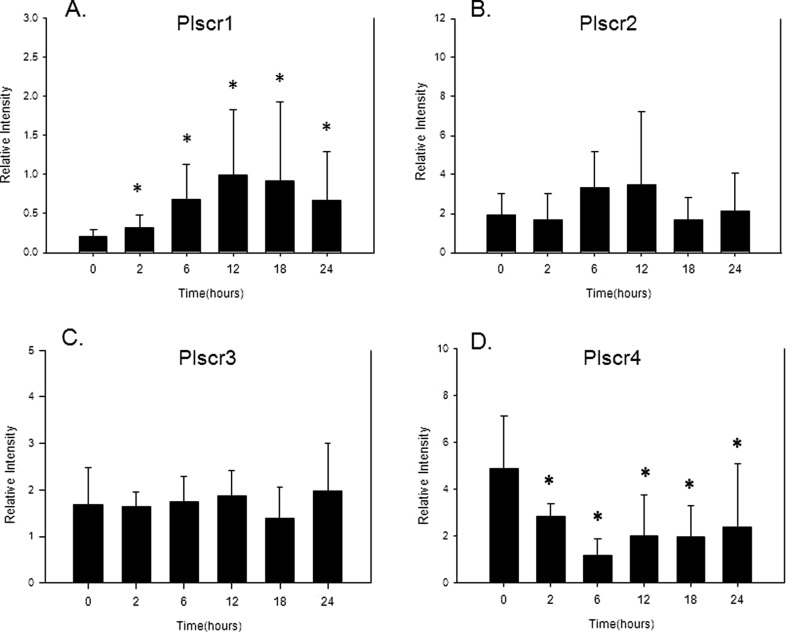
Figure 1.
Bar graphs demonstrating RT-PCR results in relative intensity (based on standard curves generated for each primer set) for the level of mRNA expression for PLSCR-1 (A), PLSCR-2 (B), PLSCR-3 (C), and PLSCR-4 (D) at multiple time points (ie, at 2, 6, 12, 18, and 24 hours) after intrauterine LPS injection along with time 0 untreated control mice. Data are presented as mean ± standard deviation, N = 5-7, and (*) represents P < .05 compared to time 0 control samples. RT-PCR indicates reverse transcriptase–polymerase chain reaction; mRNA, messenger RNA; PLSCR, phospholipid scramblase; LPS, lipopolysaccharide.

