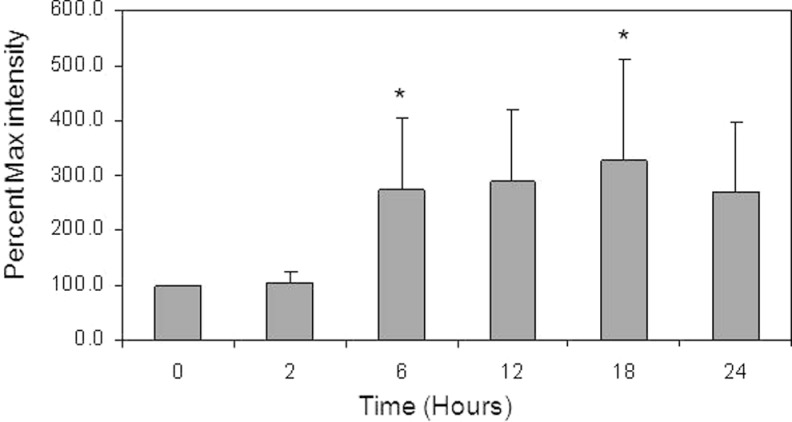
Figure 3.
Bar graph demonstrating the Western blot results for PLSCR-1 protein expression in mouse uterine tissue at 2, 6, 12, 18, and 24 hours after LPS injection. Band intensity measure (percentage max intensity) is the maximal intensity as a percentage of the average control (time 0) value. A significant increase (P < .05) was observed at 6 and 18 hours after LPS when compared to the time 0 control, as denoted by the asterisks. Data are presented as mean ± standard deviation; N = 5. PLSCR indicates phospholipid scramblase; LPS, lipopolysaccharide.

