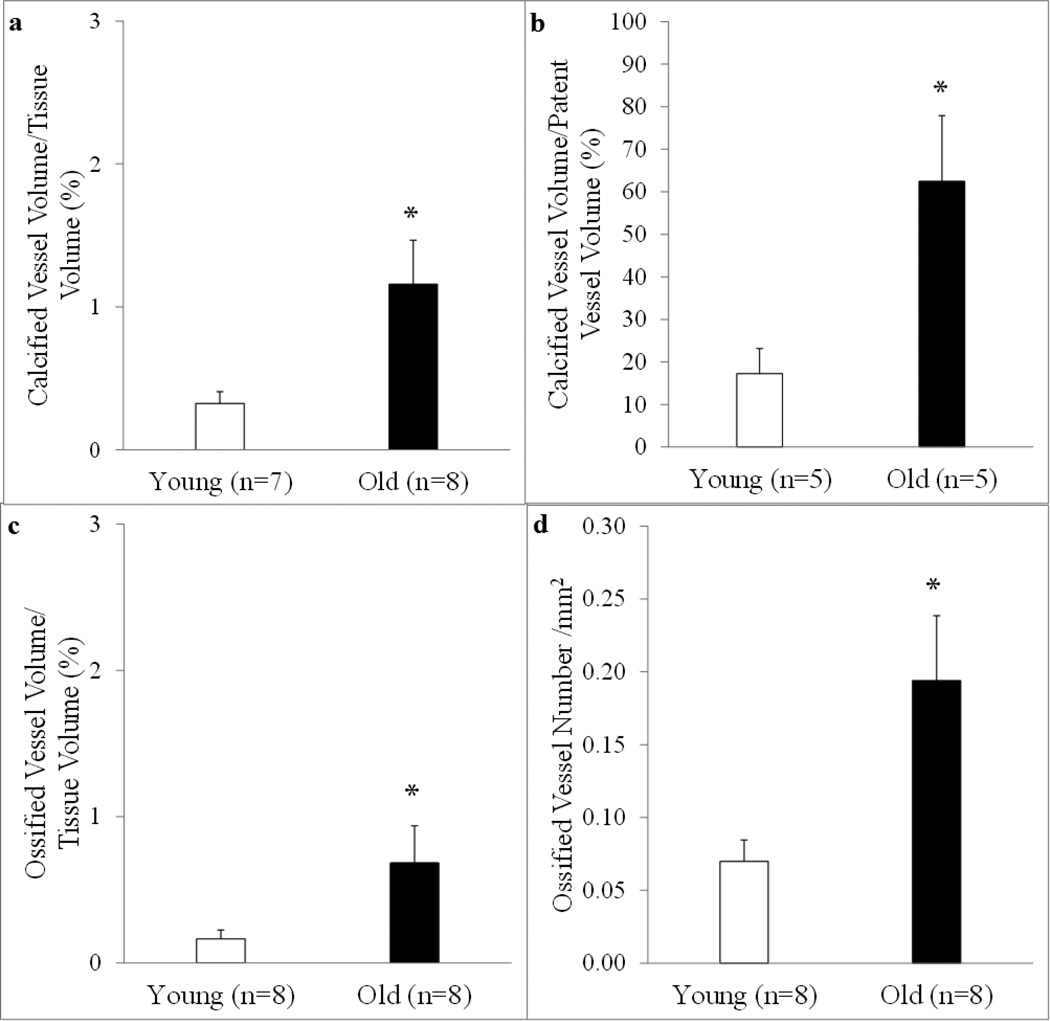
Figure 6. Quantification of calcified and ossified bone marrow blood vessels.
The calcified vessel volume per tissue volume ratio (a), calcified vessel volume per patent vessel volume ratio (b), ossified vessel volume per tissue volume ratio (c), and the number of ossified vessels (d) in the femoral diaphyses from young and old male Fischer-344 rats were quantified from the Goldner’s Trichrome- and Alizarin Red-stained sections. The volumes of calcification (a) and ossification (c) per tissue volume are higher in old vs. young rats. In addition, as the volume of calcified vessels increased, the volume of patent vessels declined (b) and the overall number of ossified bone marrow blood vessels (d) is higher with old age. Values are means ± S.E. *Denotes a significant (p < 0.05) difference from young rats.

