
Fig.2. Cortical dysplasia induced by prenatal challenges in Hsf1 KO mice.
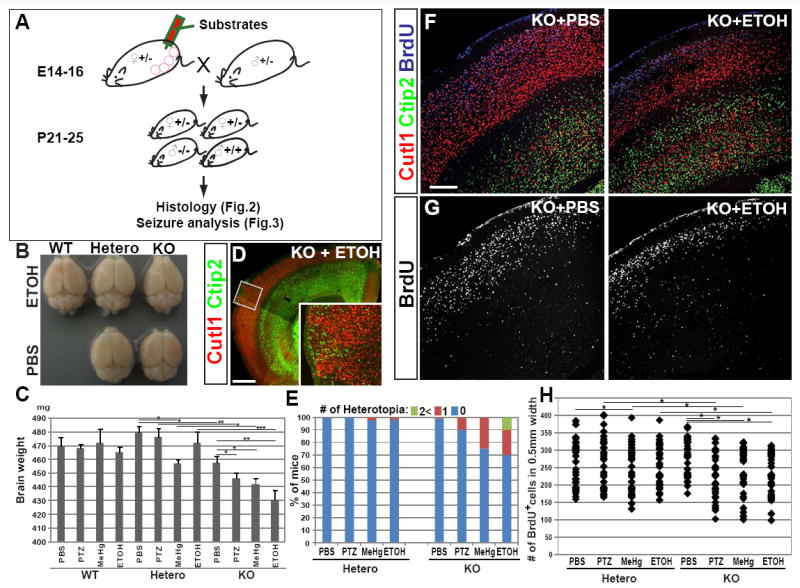
(A) Scheme for substrate administration and experiments. (B) An image of whole brains of P25 mice with indicated Hsf1 genotypes and substrate exposure, showing a slightly smaller cerebral cortex in the Hsf1 KO mouse prenatally exposed to ETOH. (C) Weight of the brains dissected at P25 from the mice with indicated Hsf1 genotypes and prenatal treatments. *p < 0.05; **p < 0.001; ***p < 0.0001 by Student’s t-test. (D) Immunohistochemistry for Cutl1 and Ctip2 in a cortical section of a P25 Hsf1 KO mouse prenatally exposed to ETOH, showing the formation of heterotopia. The inset shows the higher magnification view of leptomeningeal heterotopia seen in the boxed area. Bar = 0.5 mm. (E) Percentages of mice with one or multiple leptomeningeal heterotopias in the group of each genotype and prenatal exposure. (F,G) Immunohistochemistry for Cutl1, Ctip2 and BrdU (labeled at E15) in cortical sections of P25 mice with indicated genotypes and prenatal exposures. Bar = 0.2 mm. (H) The dot plot shows the number of BrdU+ cells in 0.5 mm wide cortical regions. BrdU+ cells were counted in the sections represented in G (n = 6 from more than 3 dams per condition). *p < 0.05 by Mann-Whitney U test. See also Figure S2.