
Fig.5. Hsf1 maintains cell cycling of NPCs upon exposure to environmental challenges.
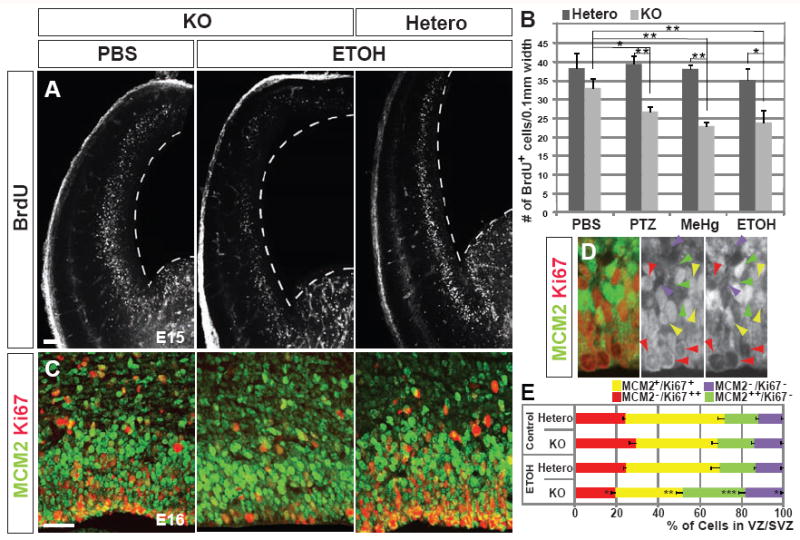
(A) Pulse-labeling with BrdU for 30 minutes at E15 in the cortex of PBS- or ETOH-exposed embryos with indicated genotypes. The number of BrdU+ progenitors is decreased in the Hsf1 KO cortex exposed to ETOH. Broken lines indicate the VZ surface. Bar = 0.25 mm. (B) Quantification of BrdU+ cells in the cortices of Hsf1 mice exposed to indicated substrates. *p < 0.05; **p < 0.005 by Student’s t-test. n = 8 embryos from multiple dams for each experimental condition. (C, D) Immunostaining for MCM2 and Ki67 in PBS- and ETOH-exposed E16 embryonic cortices with indicated genotypes. The numbers of MCM2++/Ki67- quiescent NPCs and MCM2-/Ki67- post-mitotic cells are increased, whereas MCM2-/Ki67++ active NPCs and MCM2+/Ki67+ NPCs, which are likely in transitional states at M/G1(0) or G1(0)/s, are decreased in the KO cortex exposed to ETOH. Bar = 0.1 mm. (D) Higher magnification view shows immunostaining in the PBS-exposed heterozygote cortical slice. Green, red, yellow and purple arrowheads indicate the MCM2++/Ki67-, MCM2-/Ki67+, MCM2+/Ki67+, and MCM2-/Ki67- cells, respectively. (E) The percentages of cells with indicated labeling of MCM2 and Ki67 in the VZ/SVZ. *p = 0.05; **p = 0.02; ***p =0.01, respectively, compared with heterozygotes exposed to ETOH or KO embryos exposed to PBS by the Student’s t-test. n = 4 embryos from multiple dams for each experimental condition. See also Figure S4.