
Fig.7. Cell-to-cell variability of HSP70 mRNA levels in response to environmental challenges is increased in SZ NPCs.
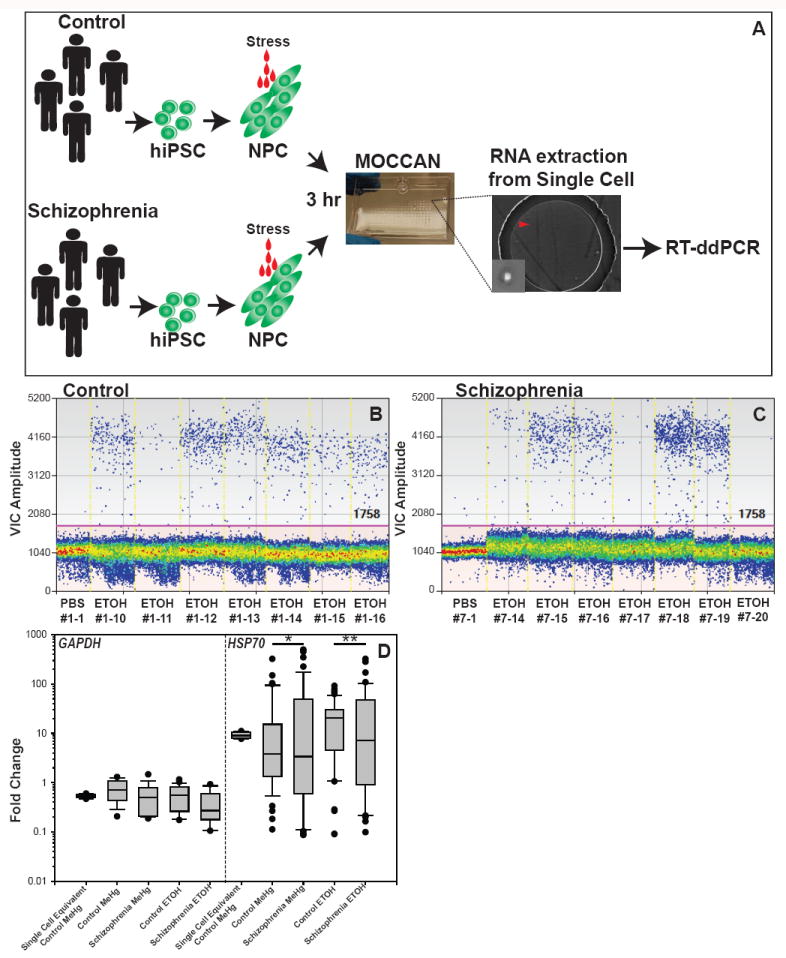
(A) Schematic representation of the experiment. (B,C) Representative results of single cell ddPCR of human HSP70 (VIC label) in control (B) and SZ NPCs (C). The clone number of each cell and substrates applied are shown under the graph. The red line shows cut-off of positive and negative droplets. (D) Graph shows fold change of GAPDH and HSP70 expression compared with PBS exposure. Significantly increased variability was observed in schizophrenic NPCs as compared with the control (*p<0.0001, **p=0.002 by Levene’s test, n>50). Significant differences in the comparison of means were not observed in all sets of comparisons (p>0.05 by Welch’s t-test). The single cell equivalents were made by using 1/10 of a pool of 10 lysed cells for the template of reverse transcription (10 biological replicates were used).