Figure 5.
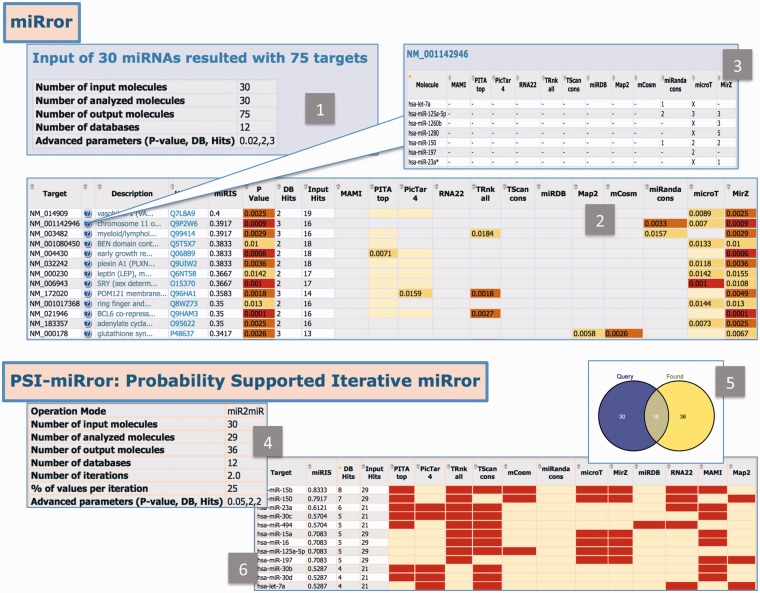
miRror2.0 and PSI-miRror results. The outputs of miRror2.0 and PSI-miRror are shown in panels 1–3 and 4–6, respectively. (1) A summary table for the miR2Gene mode. The chosen parameters and the number of analyzed molecules are listed. (2) The P-value thresholds are colored. The cases in which the MDB provides no prediction or a prediction that is below the selected threshold are color-coded. The table is sorted according to miRIS. (3) Zoomed table for each of the resulted gene is shown. The supported MDBs and the number of binding sites reported for each are marked. (4) PSI-miRror results in the miR2miR operational mode. (5) The Venn diagram that shows the number of genes that was included in the query as well as the number of molecules following the PSI-miRror iterations. (6) A summary table ranked by miRIS. The MDBs that contributed to the recovering of the selected genes are indicated in red.

