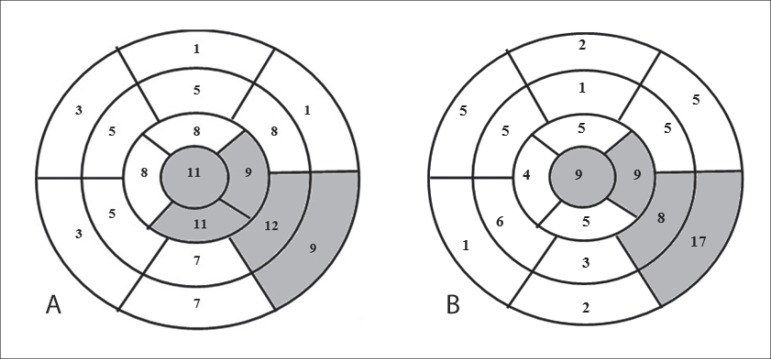
Figure 1.
Representation of the 17 left ventricular wall segments. (A) The figure in each segment indicates the number of patients with segmental wall motion abnormality. The grey color represents the segments most frequently affected by segmental wall motion abnormality. (B) Number of patients with fibrosis in each left ventricular wall segment. The grey color represents the segments most frequently affected by fibrosis.

