
Figure 3.
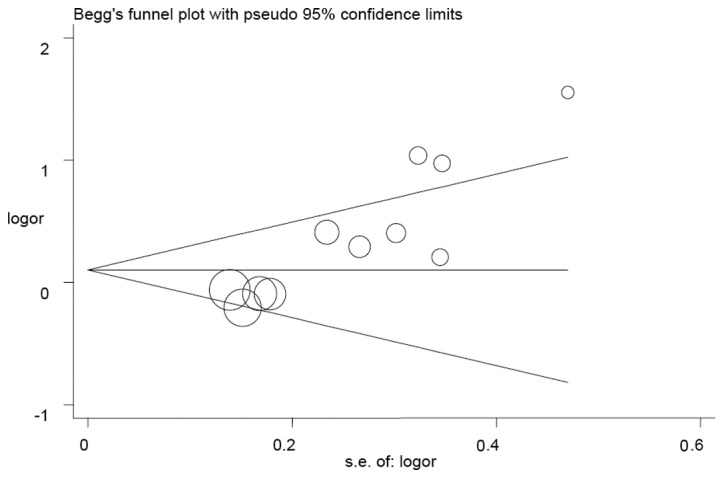
Begg’s funnel plot analysis was used to detect publication bias for the AA vs. GG + GA model. Each point represents a separate study.
Official websites use .gov
A
.gov website belongs to an official
government organization in the United States.
Secure .gov websites use HTTPS
A lock (
) or https:// means you've safely
connected to the .gov website. Share sensitive
information only on official, secure websites.
Begg’s funnel plot analysis was used to detect publication bias for the AA vs. GG + GA model. Each point represents a separate study.