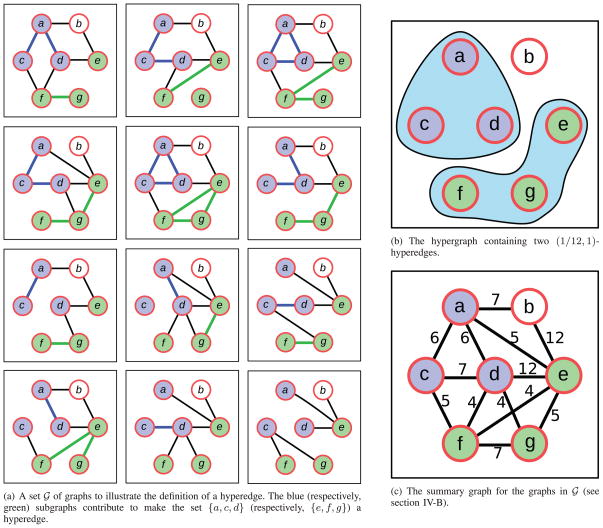
Fig. 1.
An illustration of a set
 of graphs, two hyperedges defined by
 , and the summary graph of
 . In Fig. 1c, to aid clarity, we show the number of occurrences of each edge in a graph in
 , rather than the fraction of graphs in which the edge occurs.

