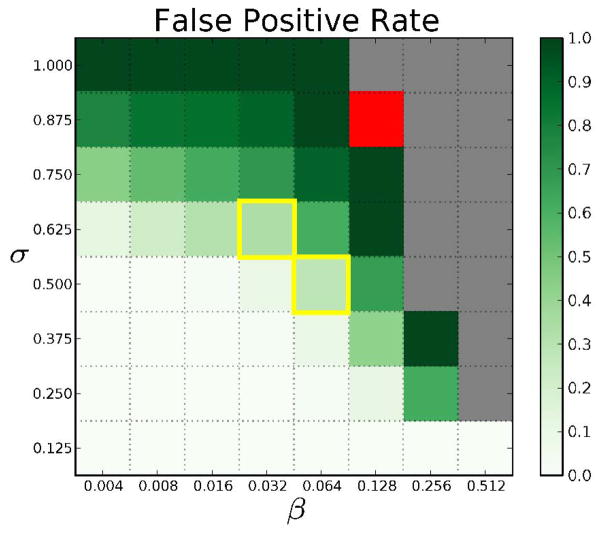
Fig. 6.
Visualization of the false-positive rates in the hyperedges computed from the ensemble of APNs. Red cells correspond to parameter values for which our algorithm did not compute any cluster for k = 3. Gold boxes highlight pairs of β and σ we used for further biological analysis. Gray cells indicate pairs of β and σ that are invalid, i.e., no collection of graphs can support hyperedges with such high values of β and σ. In other words, βσ > 1/23.

