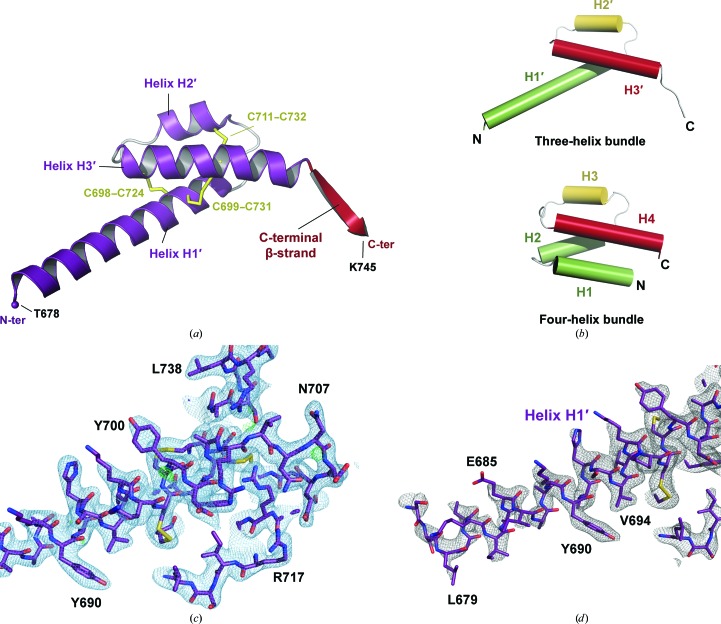
Figure 2.
General overview of the hC5a-A8 structure. (a) Overall structure of human C5a-A8 at 2.4 Å resolution. (b) Comparison of the three-helix bundle of hC5a-A8 with the four-helix bundle of hC5a as part of C5 (Fredslund et al., 2008 ▶). (c) Final model and electron-density maps for the hC5a-A8 structure. The 2mF o − DF c map is shown as a blue mesh and contoured at 1σ. The mF o − DF c map is shown as a green mesh and contoured at 3σ. (d) OMIT electron-density map calculated using simulated annealing from a model where residues Thr678–Ser693 (the first half of helix H1′) have been deleted. The 2mF o − DF c OMIT map is shown as a grey mesh and contoured at 1σ. The final complete model is superimposed to show the quality of the fit.

