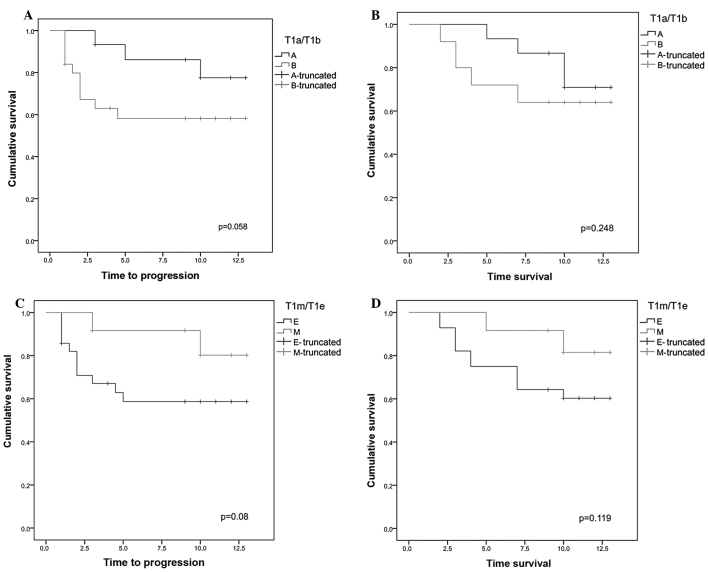
Figure 1.
(A) Kaplan-Meier curves regarding disease progression in groups T1a and T1b. The stage T1a group exhibited a disease progression rate of 13.3 and 20% at 5 and 10 years, respectively; in the T1b stage group, the disease progression at 5–10 years was 40% (P=0.058). (B) Kaplan-Meier curves regarding disease-specific survival (DSS) in groups T1a and T1b. In the stage T1a group the DSS rate at 5 and 10 years was 93.3 and 73.3%, respectively, whereas the T1b stage group exhibited 5- and 10-year DSS rate of 72 and 64%, respectively (P=0.248). (C) Kaplan-Meier curves regarding disease progression in groups T1e and T1m. In the stage T1m group the percentage of patients free of disease progression at 5 and 10 years was 91.7 and 83.3%, respectively, whereas in the stage T1a group it was 60.7% at 5 and 10 years (P=0.08). (D) Kaplan-Meier curves regarding DSS in groups T1m and T1e. In the stage T1m group the DSS rate at 5 and 10 years was 91.7 and 83.3%, respectively, whereas in the stage T1e group it was 71.4 and 60.7% at 5 and 10 years, respectively (P=0.119).

