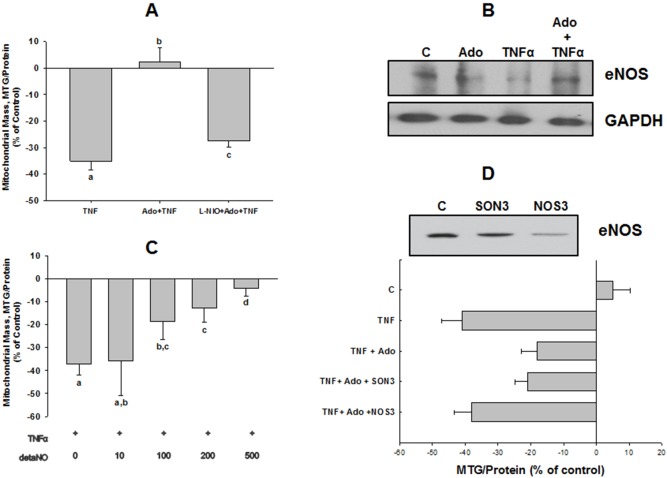
Figure 4. Effect of adenosine (Ado) is mediated by eNOS/NO-dependent mechanism.
(A) Cells were prepared and treated as described for Figure 3, except that in one group, cells were preincubated for 15 min with L-NIO (100 µM) prior to addition of Ado and TNFα. Mitochondrial mass was assayed using MTG fluorescence as described for previous figures. Values reported are from 3 separate replications of the experiment per group, differing letters denote significant between-group differences, P<0.05. (B) Western blot of total eNOS expression in response to TNFα vs. Ado+TNFα; blot shown is from the same experiment shown in Figure 3B. (C) Cells were incubated with TNFα in the presence or absence of graded concentrations of the NO donor, detaNO, followed by measurement of MTG fluorescence. Differing letters denote significant dose-dependent differences (p<0.05). Experiment was repeated 4 times. (D) Upper panel: western blot of HMEC-1 total eNOS expression, 48 h after transfection with either morpholino eNOS antisense (NOS3) or invert control (SON3) oligonucleotides. Lower panel: MTG fluorescence in cells treated with TNFα±Ado in either non-transfected cells or cells transfected with control or eNOS antisense morpholino oligos. Experiment was repeated 4 times per group, differing letters denote significant between-group differences (p<0.01).

