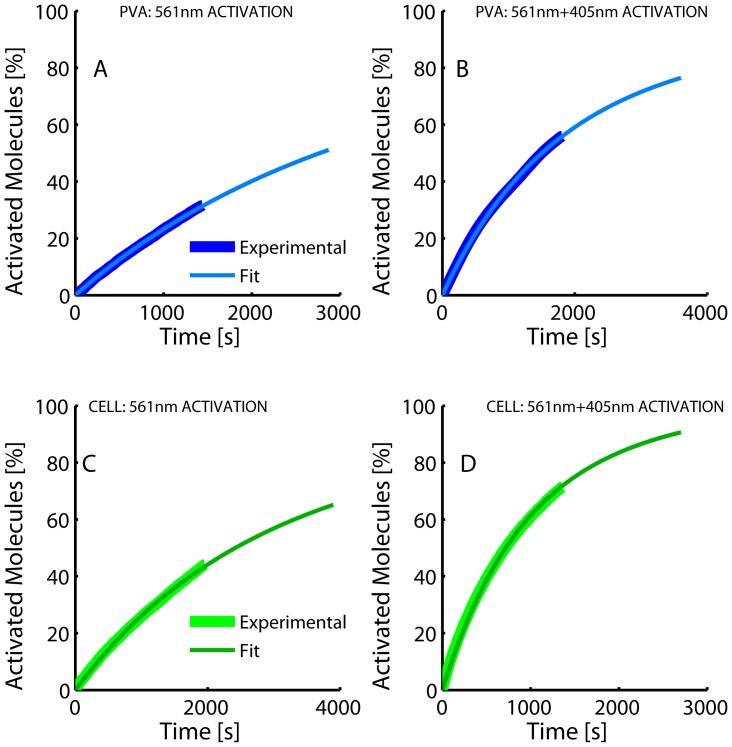
Figure 7. Representative cumulative photoconversion plots of purified Dendra2 embedded into PVA film (A, B) and Dendra2-actin expressed in mammalian cells (C, D); (illumination with 561 nm laser only (A,C) or in combination with 405 nm laser (B, D).
Fitted curves are shown overlaid on experimental data.

