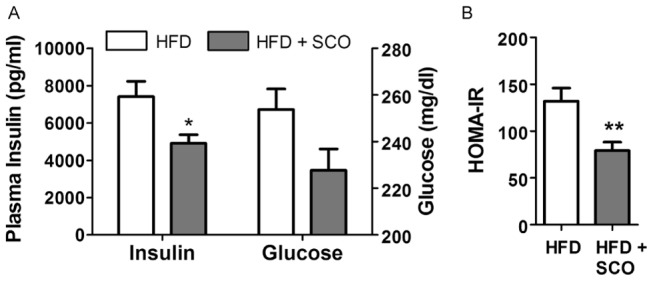
Figure 4. SCO decreases insulin and glucose levels in vivo.

DIO C57BL/6J mice were fed a HFD or HFD + SCO for 4 weeks. A) Following a 4-hour fast, serum insulin and glucose levels were measured. * denotes significant difference relative to HFD control (p<0.02). B) HOMA-IR was calculated from fasting insulin and glucose levels. ** denotes p<0.01. Data are presented as mean ± SEM (n = 9–10).
