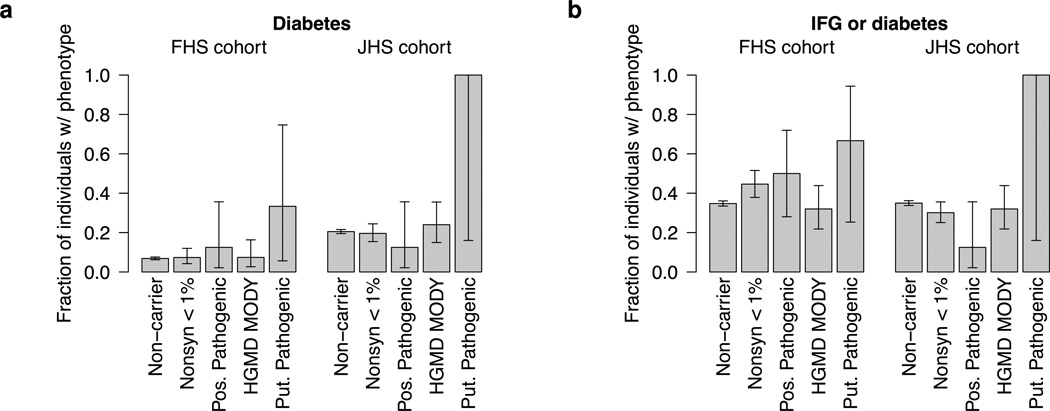
Figure 2. Phenotypic impact of variants in unselected cohorts.
Shown is the fraction of variant carriers in the two unselected cohorts with (a) diabetes and (b) IFG or diabetes. Separate fractions are given for each of the four defined variant classes, with the fraction of non-carriers with each phenotype shown as reference. Error bars reflect 68% confidence intervals in the estimated fractions and are computed via the Clopper-Pearson method. The number of analyzed samples is given in Supplementary Table 6. Fewer individuals had FPG measurements than diabetes measurements; thus the number of analyzed individuals for these two phenotypes differs. ‘Nonsyn <1%’ is low frequency non-synonymous, ‘Pos. Pathogenic’ is possibly pathogenic, and ‘Put. Pathogenic’ is putative pathogenic.

