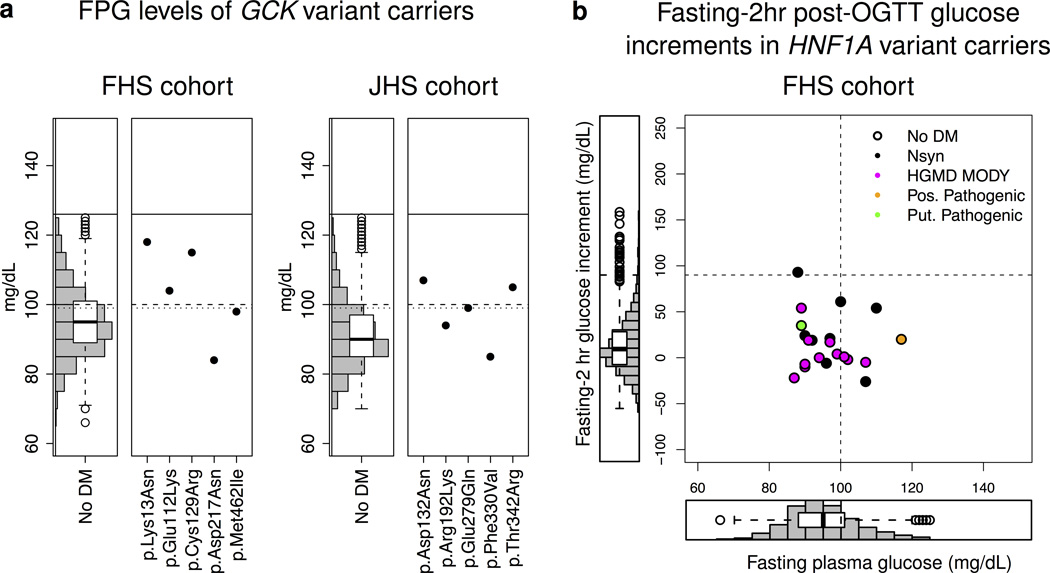
Figure 3. Phenotypes of GCK and HNF1A variant carriers.
(a) Shown are FPG values for GCK-variant carriers in the FHS cohort (left) and JHS cohort (right). Three dashed lines correspond to defined FPG thresholds: top (solid) line represents diabetes (126 mg/dL), middle (dashed) line IFG (100 mg/dL), bottom (dotted) line GCK-MODY (99mg/dL). A histogram and box plot representing FPG levels in the non-diabetic population (computed separately for each cohort) is shown for comparison. Two GCK variant carriers were on medication for diabetes and are thus excluded from the plot. Tabular form of these results (including the two carriers with diabetes) is shown in Supplementary Table 10. (b) The scatter plot shows fasting-2hr post-OGTT plasma glucose increment (y-axis) and FPG (x-axis) for each HNF1A-variant carrier in the FHS cohort (OGTT information was unavailable for the JHS cohort). Histograms showing FPG and fasting-2hr post-OGTT plasma glucose increments for individuals in the FHS cohort without diabetes are shown on the left and below the scatter plot respectively. FPG values for individuals receiving treatment for diabetes were omitted from the plot. The vertical and horizontal dashed lines represent the IFG threshold (100mg/dL) and a plasma glucose increment consistent with HNF1A-MODY/beta-cell dysfunction (≥90mg/dL) respectively. Points are colored corresponding to the annotation class of the variant; for variants that belong to multiple classes, colors are chosen according to the following precedence: putative pathogenic, HGMD MODY, possibly pathogenic, low frequency non-synonymous.

