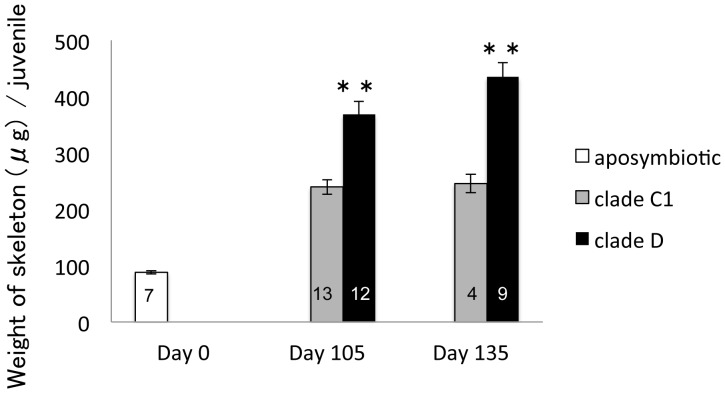
Figure 4. Skeleton weights (µg) of aposymbiotic and symbiotic polyps associated with clades C1 or D algae, 0, 105, and 135 days after inoculation.
The number of polyps in each treatment are described in each bar graph. Values are means ± S.E. Asterisks indicate statistically significant differences resulting from t-tests: * P<0.05, ** P<0.01.

