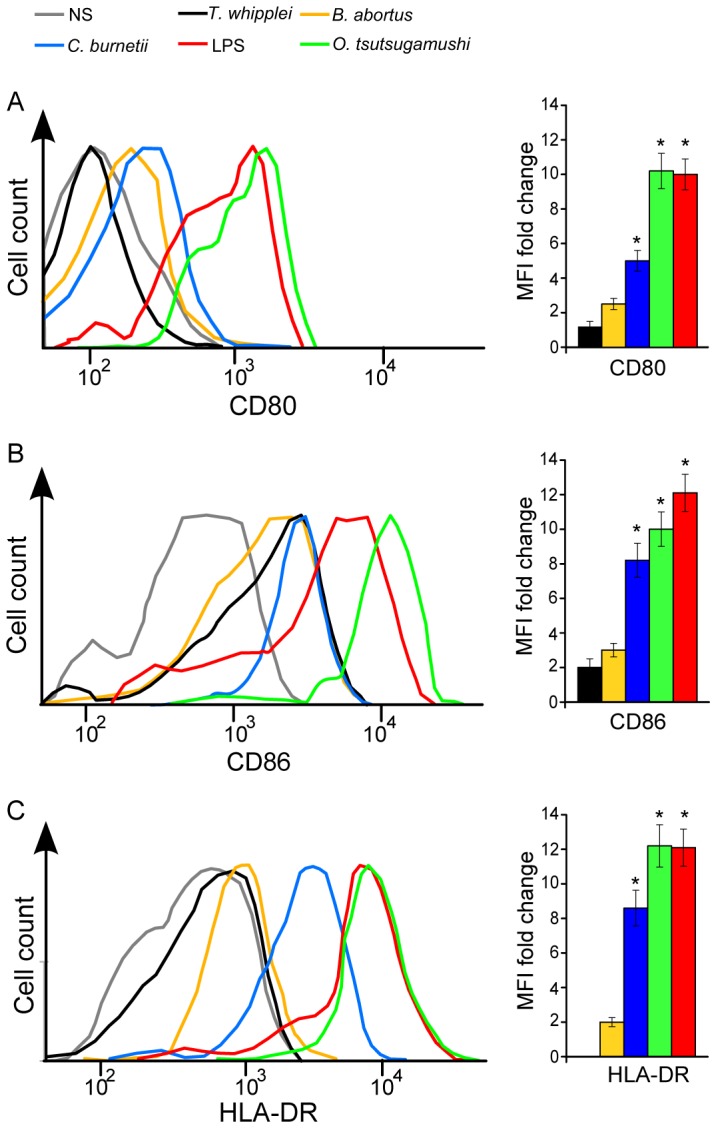
Figure 2. Phenotypic study of moDC maturation.

moDCs were stimulated with bacterial pathogens or E. coli LPS for 24 hours. The cells were then incubated with FITC-coupled anti-CD80 (A), PE-coupled anti-CD86 (B) and FITC-coupled anti-HLA-DR (C) Abs for 30 minutes and analyzed by flow cytometry. The histograms are representative of three different experiments. The bar charts represent the MFI FC values of stimulated moDCs compared with unstimulated moDCs. *p<h0.05.
