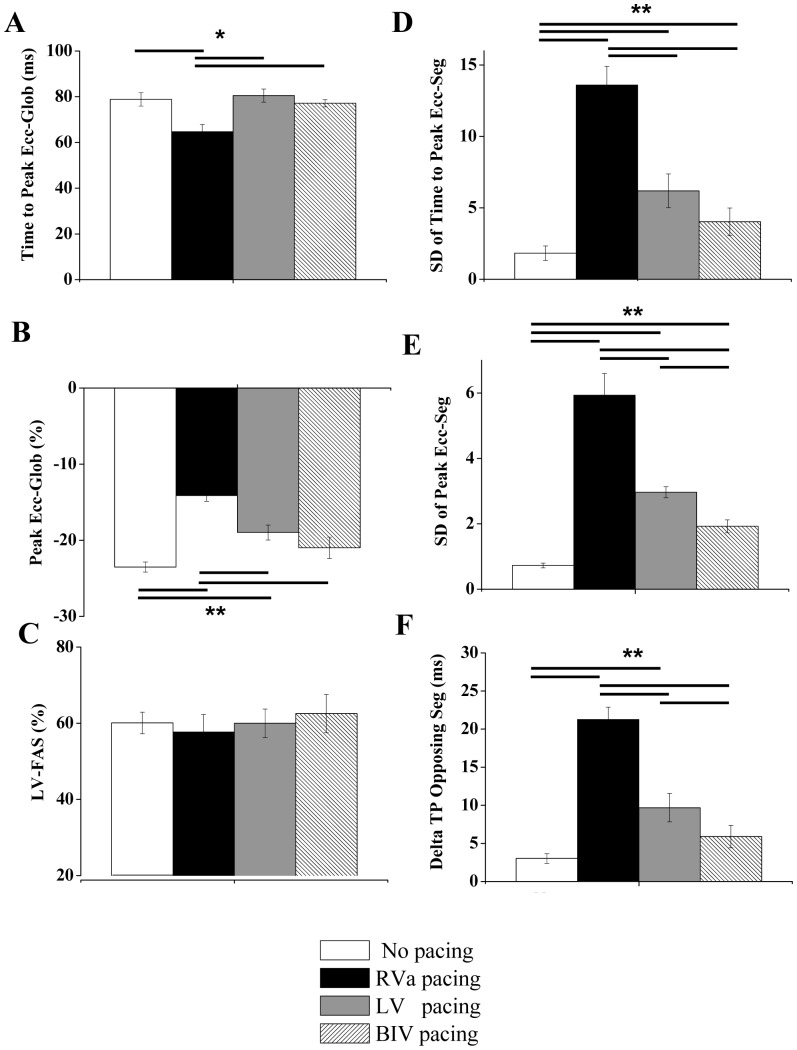
Figure 6. RV pacing induces mechanical dyssynchrony compared to LV and BIV pacing.
Summary of echocardiographic parameters in six animals subjected to no pacing, RV, LV and BIV pacing. A: Average time to peak Ecc of all six segments (global). B: Average peak Ecc of all six segments (global) C: LV fractional area shortening D: Standard deviation of the time to peak Ecc of different segments. E: Standard deviation of the peak Ecc of different segments. F: Average time difference between the peak Ecc of opposing segments (‘delta TP opposing segments’, see Figure 3 for details). * P<0.05, ** P<0.01. Horizontal lines above\below the bar graphs indicate significant differences between pacing modes in the post-hoc analysis.

