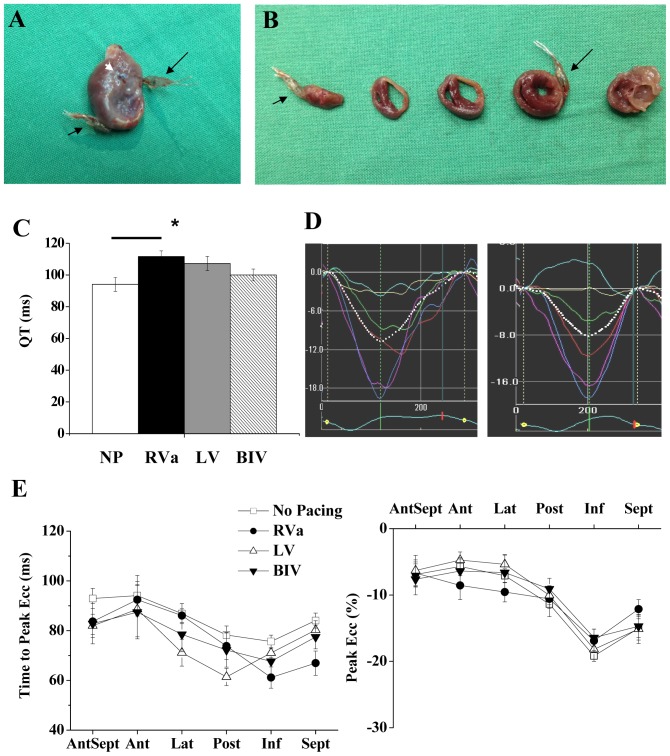
Figure 7. Combined model of pacing and ischemic heart failure.
A: Anterior image of a heart subjected to electrodes implantation in combination with left coronary ligation. RV electrode and LV electrode are marked by short and long black arrows, respectively. White arrow; coronary artery ligation site. B: Transverse sections of the heart shown in A. Apical to basal sections are ordered from left to right. C: Summary of QT interval analysis in five instrumented rats with MI. * P<0.01. Horizontal line above the bar graph indicate significant difference in the post-hoc analysis. D: Representative strain waveforms of two instrumented rats with MI under control conditions. E: Average segmental time to peak Ecc (left) and peak Ecc (right) in five rats with ischemic heart failure subjected to no pacing, RV, LV and BIV pacing.

