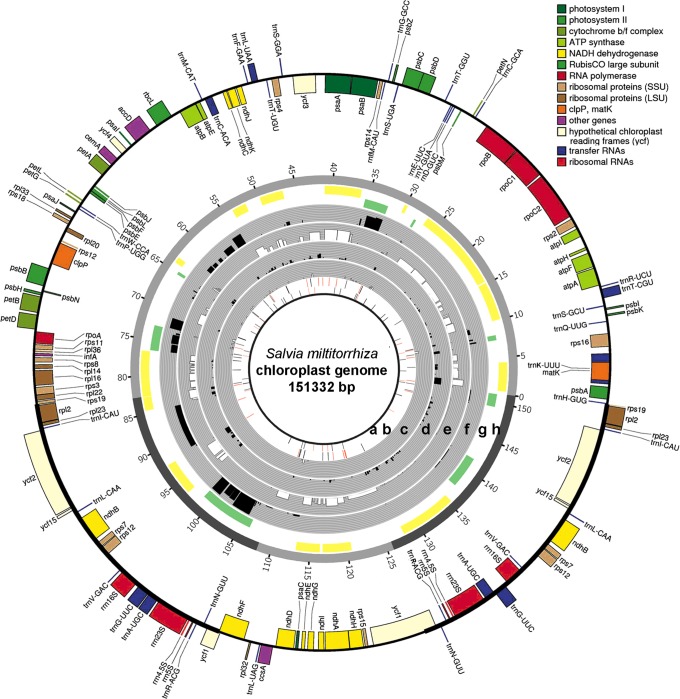
Figure 1. Ideogram showing the transcriptome and DNA modifications of the Salvia miltiorrhiza chloroplast genome.
The predicted genes are drawn on the outermost circle. Those drawn outside the circle are transcribed in a clockwise direction, whereas those drawn inside the circle are transcribed in a counterclockwise direction. The distributions of DNA modification motif 1 on the positive strand (a) and the negative strand (b) are shown as bars. The red bar indicates motifs that are significantly modified. The expression levels of the noncoding genes on the positive (c) and negative strands (d); the coding genes on the positive (e) and negative strands (f) are shown in black and white arcs on grey background, The polycistrons on the positive (g) and negative strands (h) are shown as green and yellow arcs on white background. The heights of the arcs in (c) to (h) represent the expression levels of the corresponding transcripts.

