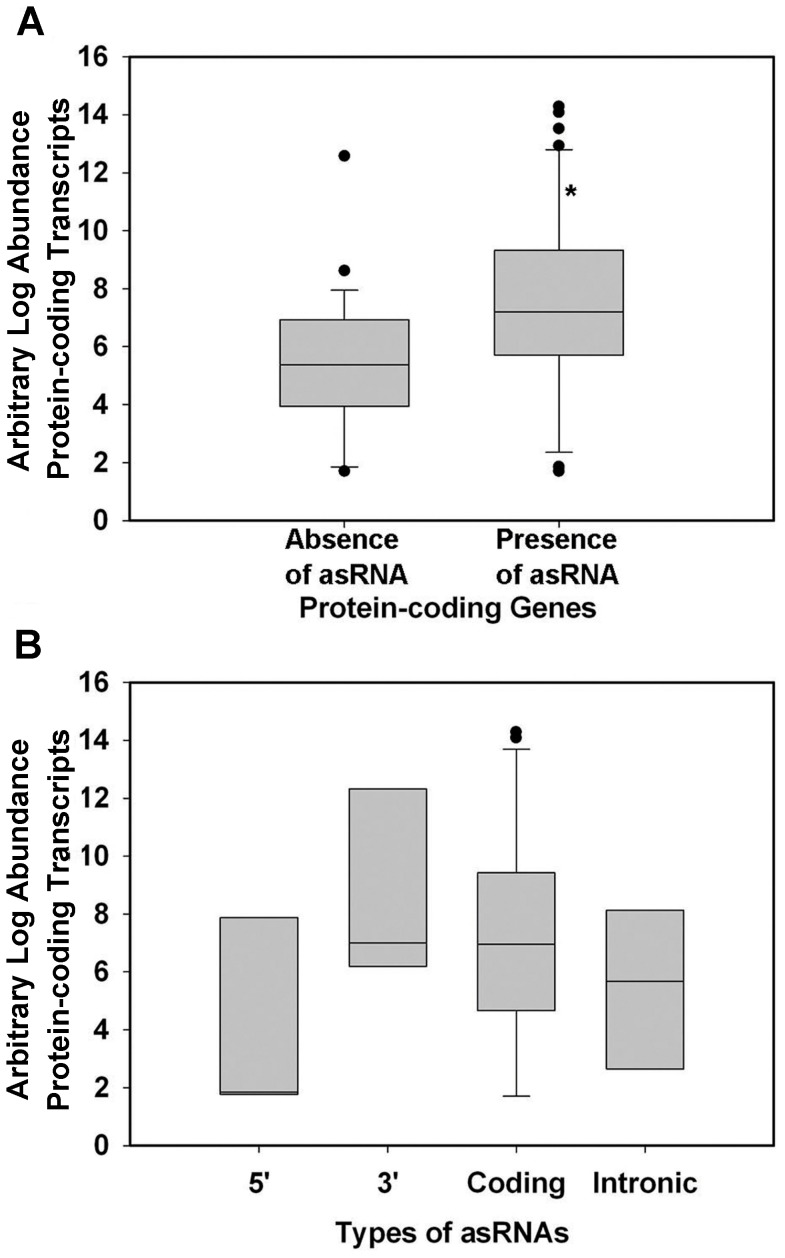
Figure 4. Effects of asRNA on the expression of the corresponding cRNA.
(A) log abundance of cRNA with and without asRNA. (B) log abundance of cRNA in the presence of four different types of asRNA. The line in the middle of the box represents the mean. The upper and lower borders of the boxes indicate the 75% and 25% quantile lines, respectively. The ends of the whiskers represent two standard deviations from the mean. “*” indicates that the difference is significant (p<0.05) based on a Student's t-test.

