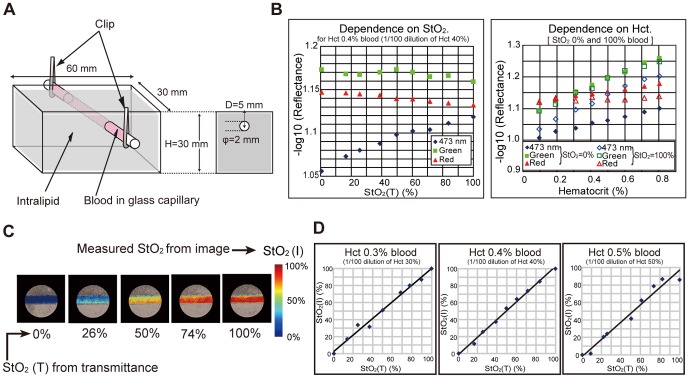
Figure 2. Verification of hemoglobin oxygen saturation imaging by observing a phantom.
(A) Blood vessel phantom consisted of a glass tube filled with diluted blood and aqueous solution of intralipid. The intralipid solution strongly scattered incident light to simulate the living tissue around blood vessel. (B) The observed optical densities of the blood vessel at the three bands were dependent on StO2(T) (left) and Hct (right). Here, StO2(T) denotes the supposedly correct value of StO2 derived by analyzing the transmittance spectrum of blood. (C) StO2(I) map (derived by image processing) of the vessel. (D) Comparison of StO2(I) with StO2(T) (derived by measurement of transmittance spectra).

