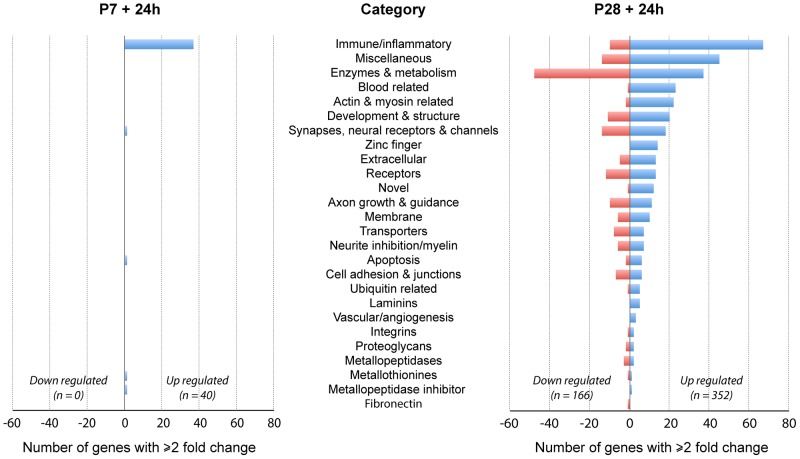
Figure 2. Changes in gene expression in spinal cord 24Monodelphis domestica.
Numbers of genes in each functional category that showed ±≥2 fold change compared to uninjured aged matched controls. Note dominance of immune/inflammatory genes particularly at P7. Also note that at P28 many more genes showed expression changes (both up and down). See Tables S1 and S2 for gene descriptions, fold change and p values.

