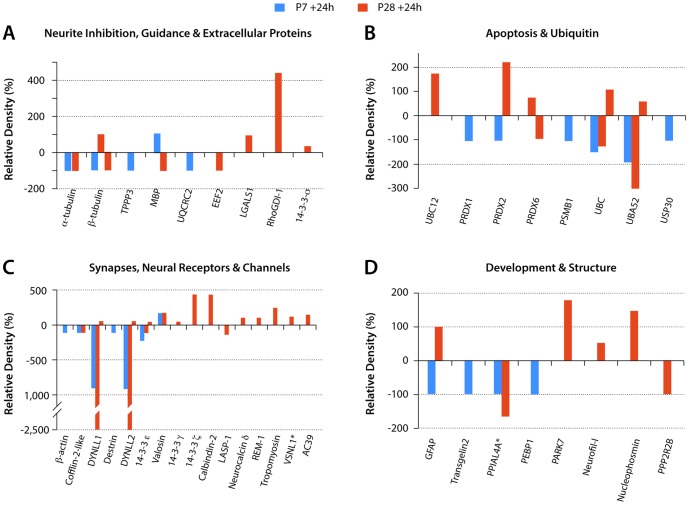
Figure 7. Proteins by functional groups with changed expression levels after spinal transection at P7 or P28.
Estimates of protein expression levels from densitometry measurements. Values are expressed as % change from control values (100%). y axis: Relative Density (%). Proteins grouped by functions as listed in Tables S4 and S5. Abbreviations: TPPP3-Brain specific protein; UQCRC2-Ubiquinol-cytochrome c reductase core protein II; EEF2-Elongation factor 2 isoform 1; LGALS1-galactin1; MBP–Myelin basic protein; PRDX1-peroxiredoxin1; PRDX2–peroxiredoxin 2; PRDX6–peroxiredoxin 6; PSMB1-Proteasome subunit β type 1; UBC–Ubiquitin C; UBA52-Ubiquitin A-52; USP30-Ubiquitin specific peptidase 30 phosphoglycerate kinase; BC12-NEDD8-conjugating enzyme UBC12; DYNLL1- Cytoplasmic dynein light chain 1; DYNLL2-Dynein light chain LC8 type 2; VSLN1-Visinin like-1; AC39-AC39/physophilin; GFAP–glial fibrillary acidic protein; TAGLN2-transgelin 2; PPIAL4A - Peptidylprolyl isomerase A-like PEBP1 - Phosphatidylethanolamine-binding protein 1; PARK7 - Parkinson protein 7; Neurofil-L – Neurofilament-L subunit; PPP2R2B - Protein phosphatase 2 regulatory subunit B. Two proteins, VSNL1 and PPIAL4A (marked with *) are mean values as their expression levels changes were detected in more than one fraction (see Table S4 and S5 for individual changes). Note also that a few of the proteins listed showed both up- and downregulation but only in P28 injury group.

