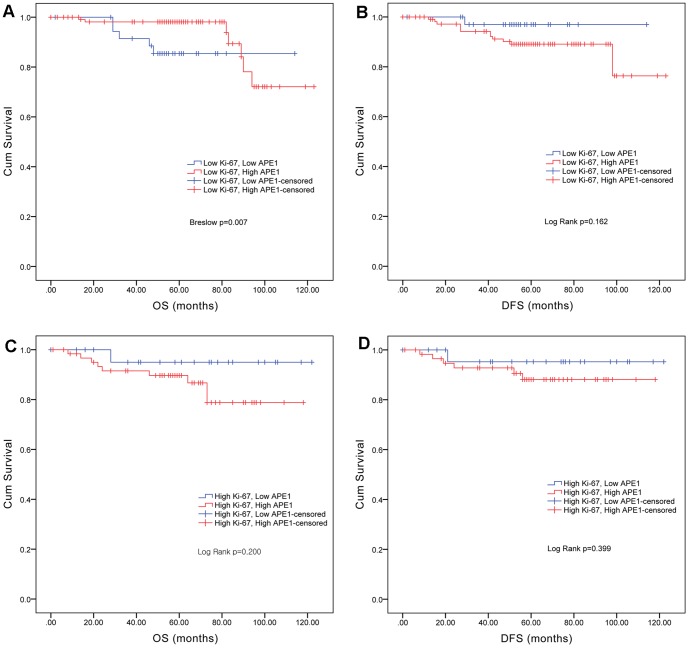
Figure 3. Kaplan-Meier survival curves based on APE1 expression levels in Ki-67-stratified cohorts.
A. OS in the Ki-67 low-level expression cohort. B. DFS in the Ki-67 low-level expression cohort. C. OS in the Ki-67 high-level expression cohort. D. DFS in the Ki-67 low-level expression cohort. Within the Ki-67 low-level expression group, APE1 low-level expression was associated with poor OS and within the Ki-67 high-level expression group, APE1 low-level expression was associated with good OS. (High APE1 (red), Low APE1 (blue).)

