Figure 3.

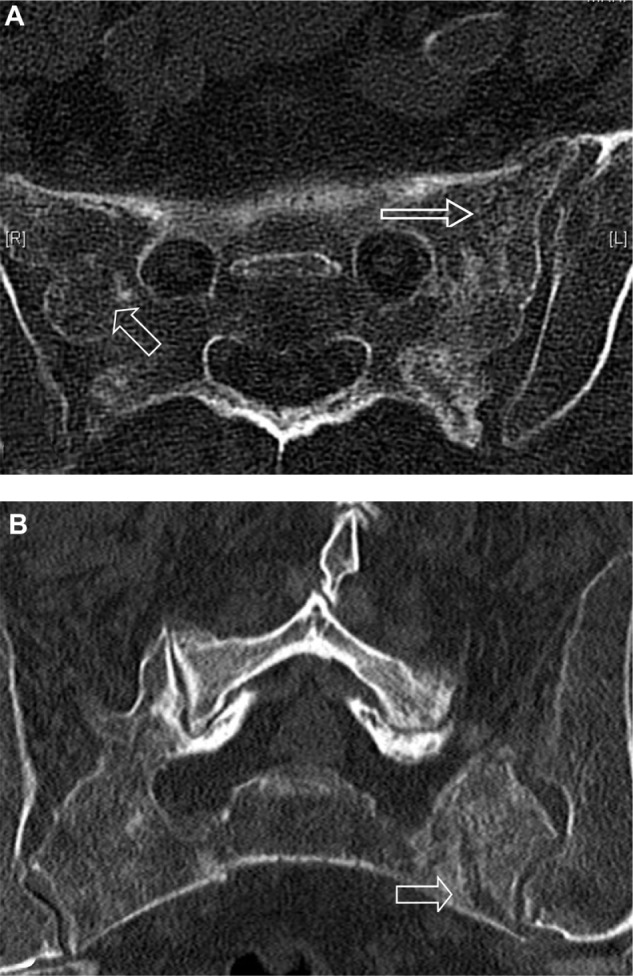
CT images of sacrum.
Notes: (A) axial and (B) sagittal views demonstrating cortical breaks with mottled sclerosis/lucency (arrows).
Abbreviation: CT, computed tomography.

CT images of sacrum.
Notes: (A) axial and (B) sagittal views demonstrating cortical breaks with mottled sclerosis/lucency (arrows).
Abbreviation: CT, computed tomography.