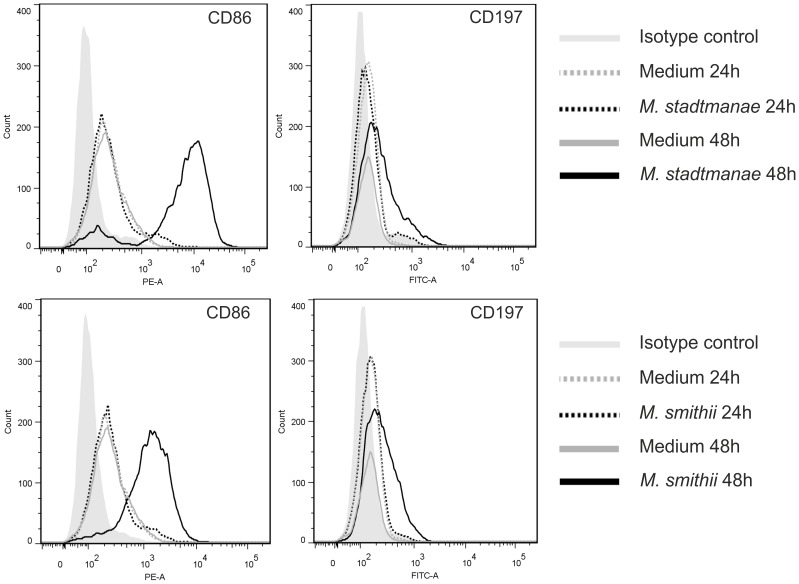
Figure 3. Increased expressions of cell-surface receptors on moDCs after stimulation with M. stadtmanae and M. smithii.
1×10⁶ moDCs were stimulated with 1×10⁷ M. stadtmanae or M. smithii cells or medium for 24 h and 48 h at 37°C. Subsequently, 2×10⁵ moDCs were incubated with antibodies (PE- or FITC-labeled) and analyzed with a FACS flow cytometer. MoDCs were selected by forward and side scattered signals before measuring the intensity of PE or FITC fluorescence signals of 10000 cells. Depicted graphics are original plots of FlowJo Software, Version 7.5.5.

