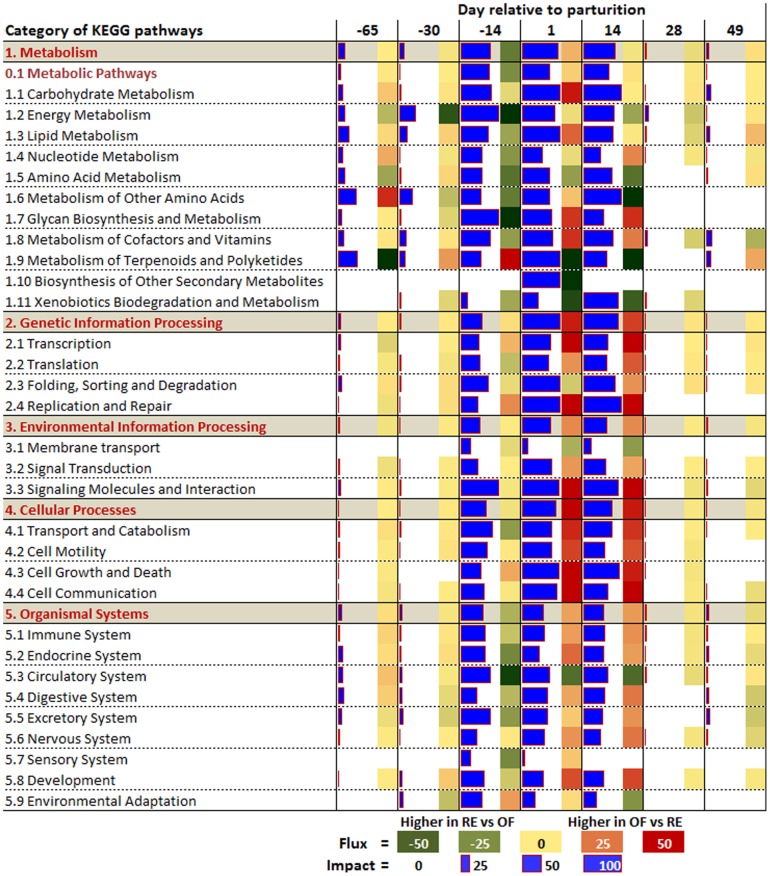
Figure 3. The summary of KEGG pathways encompassing categories and sub-categories of pathways as provided by the Dynamic Impact Approach (DIA).
The ‘Impact’ is represented by the horizontal blue bars (larger the bar larger the impact) and the ‘Direction of the Impact’ (Flux) is represented by green (more induced in RE vs. OF) to red (more induced in OF vs. RE) rectangles.

