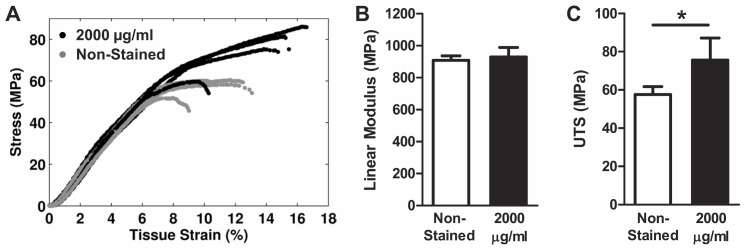
Figure 6. Results of constant strain rate testing.

(A) Plots of the stress-strain response to constant strain rate testing for 2000 µg/ml samples and non-stained controls. (B) While the linear modulus was unaffected by DTAF staining, (C) an increase was observed for the ultimate tensile strength (UTS). *p<0.05.
