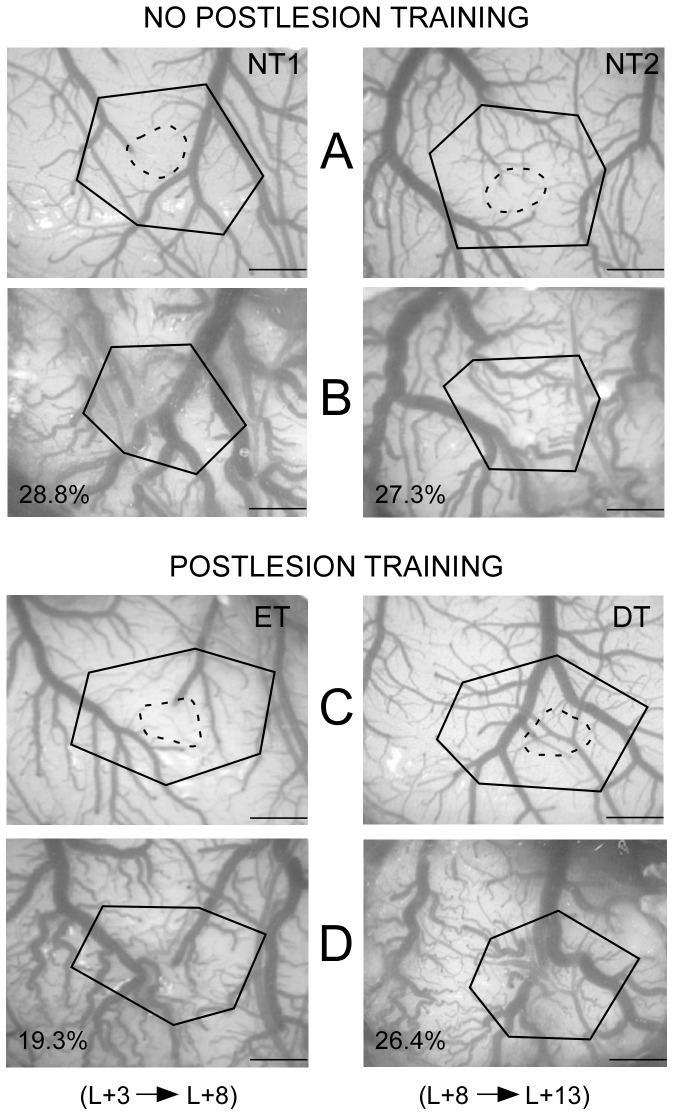
Figure 3. Cortical tissue loss after focal ischemic damage to the S1 forepaw area.
Video images of the cortical surfaces taken before (A, C) and 9 days (left column) or 14 days (right column) after the lesion induction (B, D). Images are shown for representative rats not trained (NT1 and NT2) or trained during postlesion days 3 to 8 (ET) or 8 to 13 (DT). The electrophysiologically assessed injured areas are outlined (broken line) on the image of the intact cortex. Polygons based on common vascular landmarks before and after the lesion illustrate the contraction of the cortical area due to tissue loss (percent values). Note that the estimated tissue loss was greater in the NT and DT than in the ET rats.

