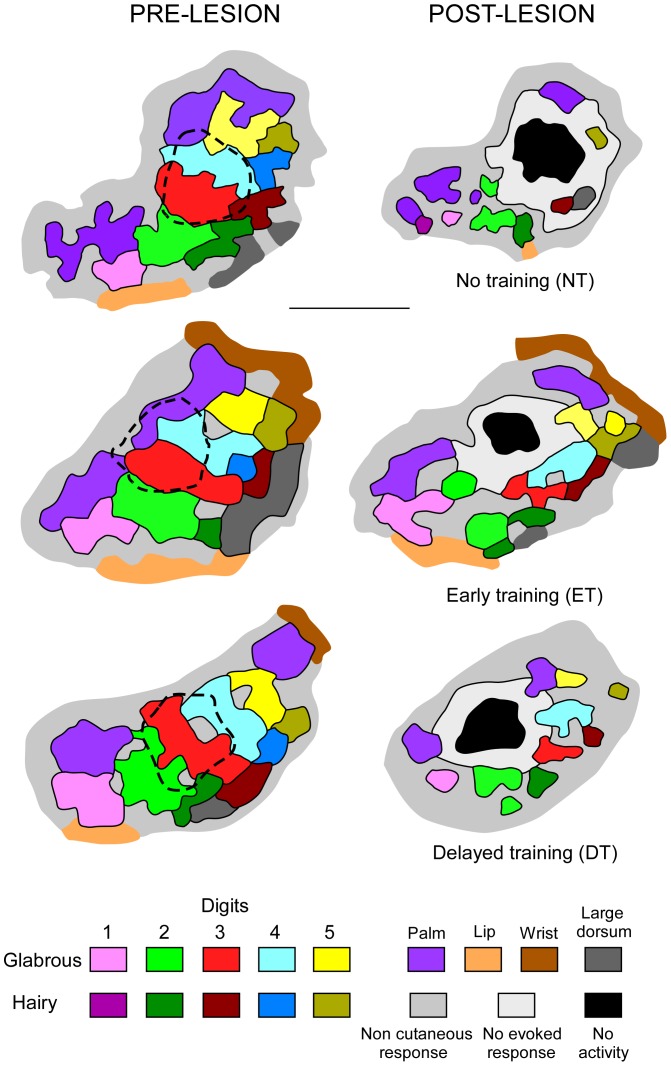
Figure 4. Forepaw representations obtained prior to and after the lesion induction.
Examples of electrophysiological maps obtained in a rat which was not subjected to tactile stimulation (NT) and in rats subjected to tactile stimulation from the 3rd to the 8th days (early stimulation; ET) or from the 8th to the 13th days (delayed stimulation; DT) after the lesion induction, while cortical remapping was performed on the 9th or 14th days, respectively. The postlesion map in the NT rat was obtained on the 9th day postlesion (NT1). For the sake of legibility, no map is shown for NT2 rats in which remapping was performed on the 14th day postlesion, as NT1 and NT2 maps were very similar. The injured areas functionally defined on the basis of neuronal recordings are outlined on the pre-lesion maps (dashed lines). The cortical sectors electrophysiologically silent (black area) or displaying decreased spontaneous activity with no elicited response (light grey area) are illustrated on the post-lesion maps. Note that the best preservation of cutaneous representational zones was recorded in the ET rat, whereas the most degraded map was found in the NT rat.

