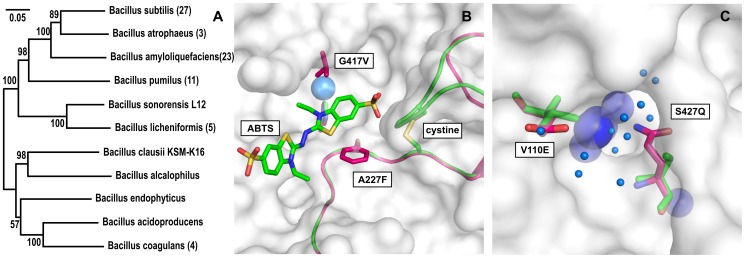
Figure 1. The cotA from B. clausii, compared to its ortholog from B. subtilis.
(A) Nearest-neighbor tree of B. clausii cotA as described in the text. The bracketed number is the number of sequences represented by each node. Bootstrap values are given at the base of each branch. (B) The substrate binding pocket of cotA highlighting the differences between B. subtilis (green) and B. clausii (purple) cotA as described in the text. Amino acid changes are numbered on the B. subtilis cotA sequence and annotated with the B. clausii cotA amino acid last. (C) The water exit channel of cotA with similar highlighting. The T2 copper site is visible through the open channel. Small blue spheres represent water from pdb structure 3ZDW. Structures were visualized using PyMol 1.5 and the tree was generated using MEGA 5.

