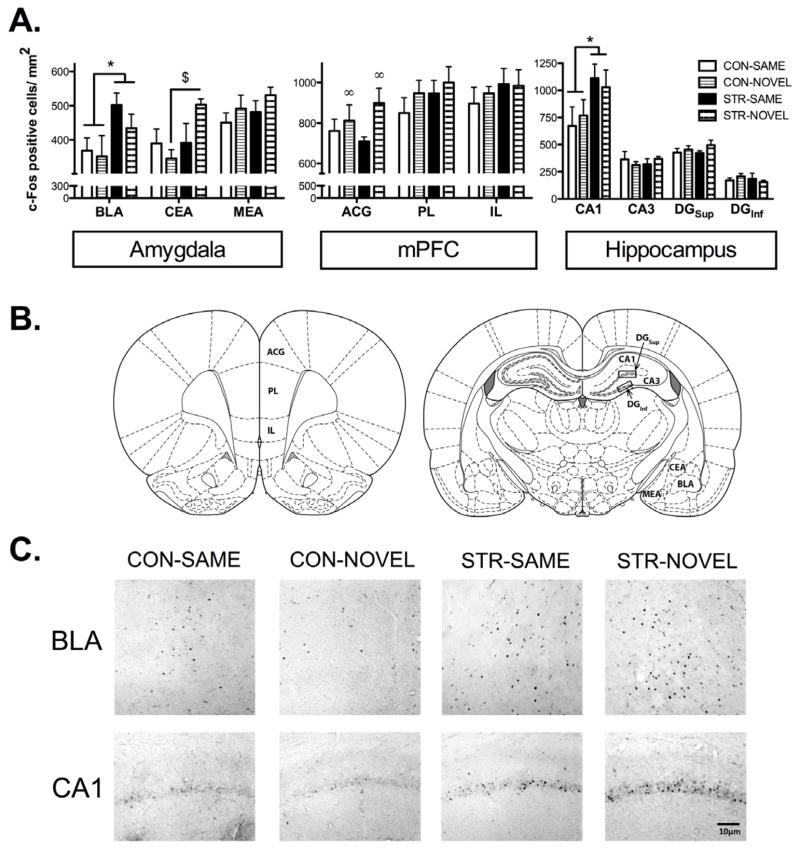
Figure 5. Fos IR labeling: Amygdala, mPFC, Hippocampus.
(A) Regardless of test context, STR showed greater Fos IR compared to CON in amygdala BLA and dorsal hippocampus CA1. When tested in a novel context, STR showed increased Fos IR in amygdala CEA compared to CON. Regardless of stress history, when either group was tested in a novel context, Fos IR was in the mPFC ACG. (B) Regions of interest in coronal sections based on the rat brain atlas by Paxinos and Watson (2007). (C) Representative Fos photomicrographs observed in the BLA and CA1. Data are represented as mean ± SEM; n=4–5/group. *p<0.05 vs. CON; $p<0.001 vs. CON-NOVEL; ∞p<0.05 vs. SAME.

