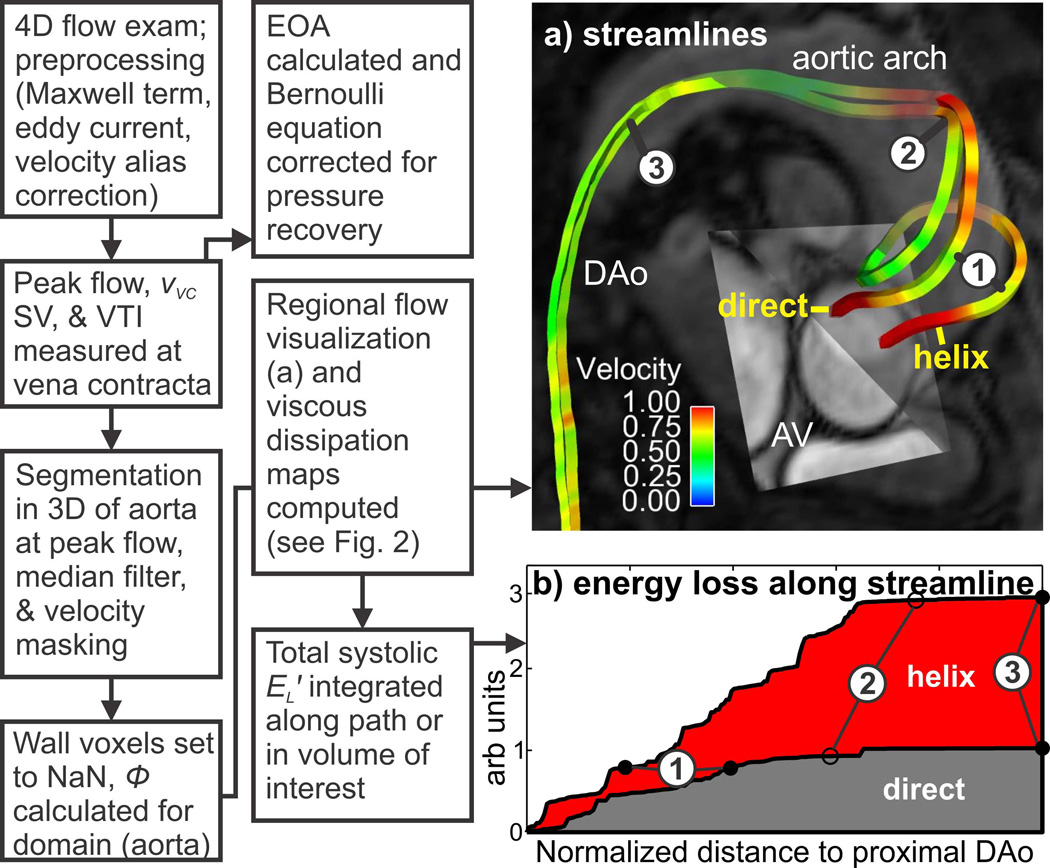
Fig. 1.
Schematic illustrating the energy loss workflow to quantify the effect of (a) two different idealized flow paths on (b) the viscous energy loss integrated along these paths (note: for the purpose of demonstration, steady flow using the velocity field at peak flow systole was assumed). The ‘helix’ path exhibits greater energy loss compared to a particle traveling along the ‘direct’ path (when traversing vascular landmark 1 to 2). A similar workflow was used to integrate the voxel-wise energy loss in the entire aorta volume in order to obtain net energy loss at a single time point. vVC: peak velocity at the vena contracta, SV: stroke volume, VTI: velocity time integral, EOA: effective orifice area, EL′: systolic energy loss, AV: aortic valve, DAo: descending aorta.

